
One of the presentations given during CTU Contest University (https://www.contestuniversity.com/) in 2016 was titled: Improving Your Contest Scores Through Log Analysis. The presentation of this topic was prepared and delivered by Valerie NV9L – an American YL, passionate about amateur radio contests. The presentation is available on the CTU website in the Files section.
While viewing (once again) this presentation, I realized that for many years, in the operator team of the SO4M station, we have not only been performing the activities described in this presentation, but also have some of our own ideas that we consistently implement. So I thought it would be worth collecting and describing this aspect of preparation for amateur radio contests.
Let’s start with the fact that preparing for amateur radio contests is a process. Just like in the case of sports competitions. It’s not like someone random suddenly appears in some discipline and breaks all records. Of course, you can have innate predispositions to practice a certain sport, but these must be developed through training and improving your skills. Moreover, just because someone wins today does not mean that he will win tomorrow, because there are many contenders for victory and each of them trains to be the best. Exactly the same applies to amateur radio contests. Every competition enthusiast prepares for the biggest contests throughout the year, and each start is material for analysis: what can be done better, can something be improved in the station configuration, is a new antenna, a better computer needed, is it worth changing the arrangement of transceivers and other devices on desks, maybe it is worth replacing the feeder, etc.
Apart from technical, logistical and work ergonomics issues, a very valuable, sometimes underestimated source of information are contest logs. And this is material that every player has.
We analyze the logs before the contest – as tips for the upcoming start. We verify them during the contest – to compare ourselves with other stations, and finally we explore the post-contest logs – immediately after the contest and in the long run. So let’s take a closer look at each of the ways to use the contest log.
Before contest
- Logs from previous years
- Contest results from previous years
- Records
- Information about upcoming “contest DXpeditions””
Before each contest, we check the results from previous years in the category in which we intend to take part. We check our own results and those of our competitors. We verify the records of Polish stations and compare ourselves to the best stations in Europe or in our WAZ or ITU zone (depending on the contest).
It’s not just about comparing yourself to the national or European leaders – not everyone has the opportunity to achieve results at this level. You can compare yourself to the stations that overtook you or simply analyze your own results or records to consider how you can improve your results in the next edition of the contest.
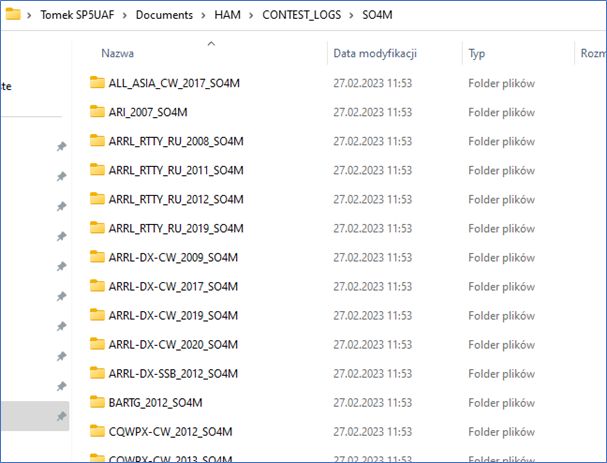
I myself have logbooks for most of the contest I competed in: individually or as a member of a Multi-Op team. I have a dedicated folder and subfolders for this purpose. After each competition, the log for a given contest is archived.
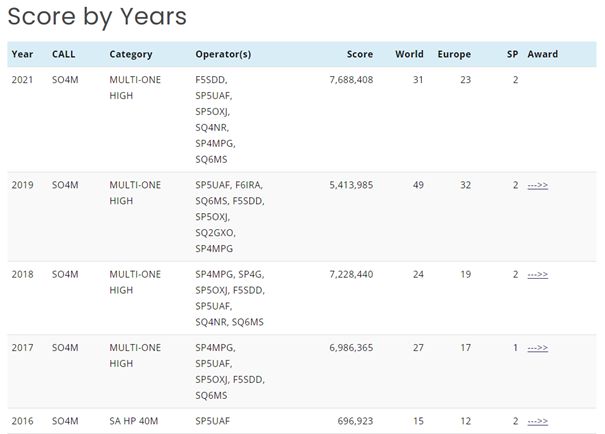
At the SO4M station, we publish our results on our website (so4m.dxing.pl) so that you can check the results achieved in particular years at any time. This part of our website is available to everyone. For example, in the case of CQ WW DX CW, the beginning of our list looks like this:
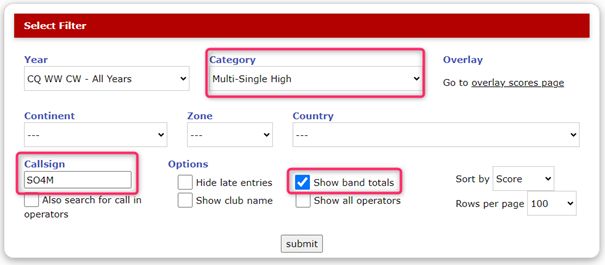
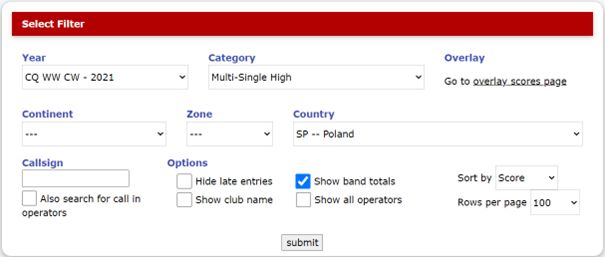
Most organizers of the largest contests provide databases with results from previous years. An example is CQ WW DX Contest. The website of these cotests has a database of results and tools that allow for flexible data search. For example, if we want to compare our own results over the years (in the CW section of the contest), we will use the search criteria shown in the image below.
In the search criteria, we indicate the category and enter the callsign of our station. It is worth selecting the Show band totals option – this will show the number of QSOs, the number of zones and the number of entities included in the result for each band.
After confirming the search, we will see, for example, the following data:
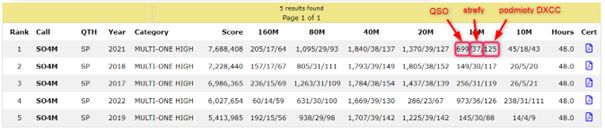
Above, it is worth paying attention to, for example, the 20m band in 2022. Just 286 QSOs. No wonder – during the CW part, we replaced the feeders in the 20m antenna. So the band was out of service most of the time. This is immediately visible in this comparative comparison.
To put it another way – in such a summary you can immediately see every failure in a given band or every bad operator’s decision regarding changing the band or transmitting direction.
Let’s see how the results of all Polish stations in the Multi-One High category for 2021 compare. We will use the following search:
We will see the following data:
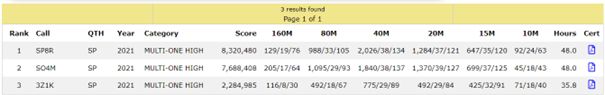
The results of SO4M and SP8R were comparable – except for the 10m band. On the lowest bands, our friends from SP8R have a better multiplier, although we have more QSOs. We know they have better receiving antennas. It’s immediately visible.
In the 40m band it is comparable – the SP8R station has more QSOs, but SO4M has a three-point better multiplier for DXCC entities. On 20 meters, the SO4M station is better in terms of QSOs and multipliers. Similarly in the 15-meter band.
And finally, the 10-meter band, which had a decisive impact on the better result of the SP8R station. At the SO4M station, we remember this start. The 10-meter band was treated rather neglectfully. We had a power amplifier that was not fully tested and failed after several contacts. Of these 45 QSOs, probably 40 are contacts on a “bare” radio (low power). In addition, we tried to repair the amplifier, which resulted in additional interruptions at 10 meters. The end result is several hundred thousand points of advantage for the SP8R station in the final result.
Were we better prepared at 10 meters the following year? Yes, but we had an antenna failure at 20m, so there was no fight for the result. What is most important, however, are the tips that result from comparisons.
When starting in cotest from the SO4M station, we usually compare ourselves with the SP8R team. We often meet in the same category, we have similar antenna and equipment potential and an experienced team of operators. We are friends with the SP8R team and we are happy to exchange information. Usually, when the deadline for sending logs has passed, we exchange logs for the competition. Thanks to this, you can compare individual bands, multipliers, rates, etc.
It is also worth paying attention to the result of the station 3Z1K – a call belonging to the SP1KRF club. Station 3Z1K does not have the antenna potential of SO4M or SP8R, but station 3Z1K consistently and regularly appears in every major competition. As a result, for several years the 3Z1K station has been taking one of the leading positions in the Intercontest KF competition (https://sq2gxo.pl/intercontest/) , which summarizes the station’s achievements in the largest amateur radio contests during one calendar year.
Concluding the topic of the CQ WW DX Contest database, it is worth noting that the search results can be exported to an MS Excel spreadsheet:
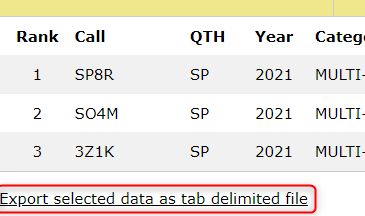
Excel has many analytical tools that allow you to compare and analyze data. The possibilities then depend only on your knowledge of MS Excel.
Unfortunately, not all organizers provide such tools and data as the CQ WW DX Contest Commission. Sometimes you need to search through the archived results yourself and enter the data into your own spreadsheet.
An excellent source of information is the SP3KEY website https://sp3key.com/. Colleagues from SP3KEY have been consistently keeping records of SP stations in many international competitions for many years. At the SO4M station, we regularly visit this website – before each contest and usually also during the contest.
The purpose of analyzing the results before the contest is primarily to set goals, analyze whether the necessary corrections have been made to increase the result on individual bands, etc. It is always worth comparing yourself to stations with higher results and thinking of them as a reference point. If we want to move forward, we have to improve our results in contests.
It is worth mentioning one more element related to the log. Before each competition, especially before the CQ WW DX Contest, we closely follow DX bulletins and the NG3K website. There are many DX trips organized specifically for contest or taking place during it. We at the SO4M station usually have a list of calls for such trips. If
During contest
- Log from the previous year or another with the compared resu
- Live Contest Server
- Where is the competition, i.e. RBNN
Modern contest programs have built-in tools that allow you to track the result in detail and compare yourself with the competition as well as with the results from previous years.
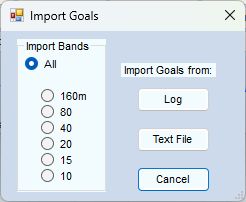
The N1MM Logger+ program provides the Goals option in the Info window. To simplify slightly, we treat the amount of contacts in a certain time period as a goal. To set such hourly goals, we can import our own log. This can be your own log from the previous year or another one, e.g. with our best result, to always refer to a “high” level. It can also be a log of another station from previous years – e.g. someone with a better result to whom we want to refer (we can view/download the log of each participant on the CQ WW competition website). After importing such a log, the N1MM program will appropriately calculate the number of QSOs and compare it with the current log when logging communications.
You can also create a file with “goals” yourself (as a text file with an appropriate layout), if, for example, you want to set hourly goals during the competition.
If we already have our “goals”, we display them in the Info window, deciding what type of data should be shown in the window:
- 20min Moving Average (moving variable for the last 20 minutest)
- 30min Moving Average (moving variable for the last 30 minutes)
- 60min Moving Average (moving variable for the last hour)
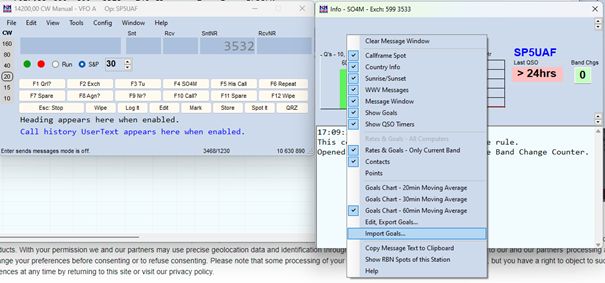
In the Info window, the program displays our “goals” on a chart, comparing them with the current log. The program also provides text information about the next goal to be achieved.
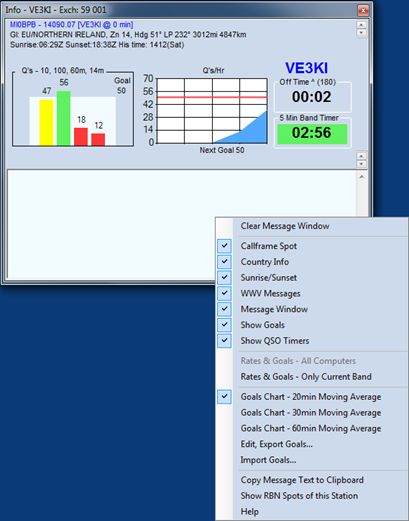
Using the Goals option is very motivating to work hard, to track the band, DX Cluster spots, propagation, etc.
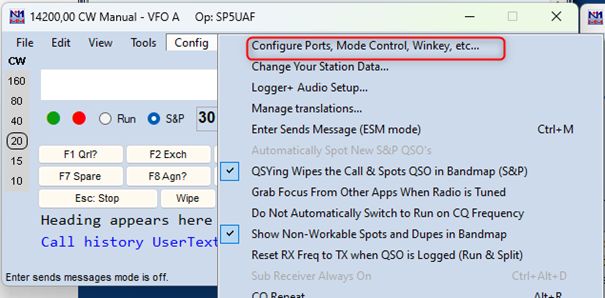
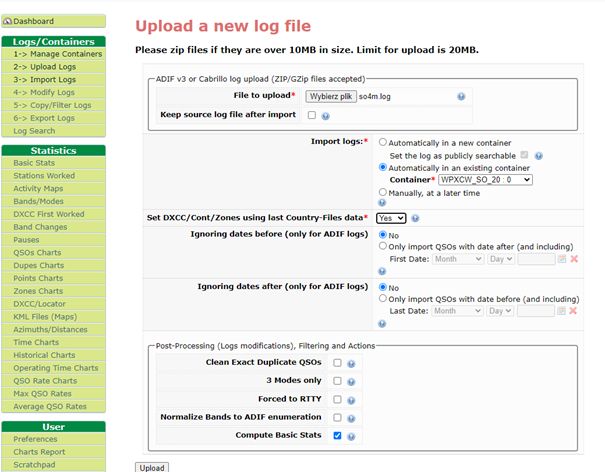
Modern contest programs also allow the results to be sent on an ongoing basis to dedicated websites, where the results are then published online. In order for the result to be sent on an ongoing basis, the contest program must be properly configured. In N1MM Logger+, this happens in the Score Reporting section, available in the program’s configuration menu:
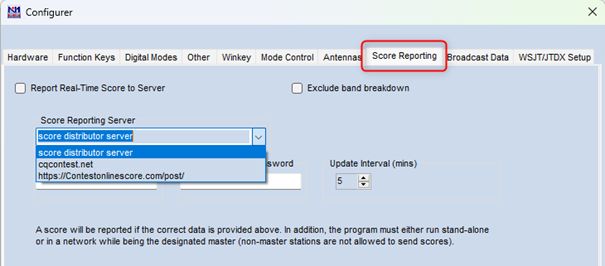
We indicate the server (service) to which the result is to be sent and the interval – we specify how many minutes the synchronization with the selected service should take place. First, you need to register on the selected website, set a password, etc. If you do all this, the rest happens “in the background” during the competition.
The N1MM Logger+ program does not have a separate window to display the results from the selected website. You should visit this website and filter the data appropriately. For example, on the website contesonline.com during the WAE DX CW competition you could see this type of comparison:
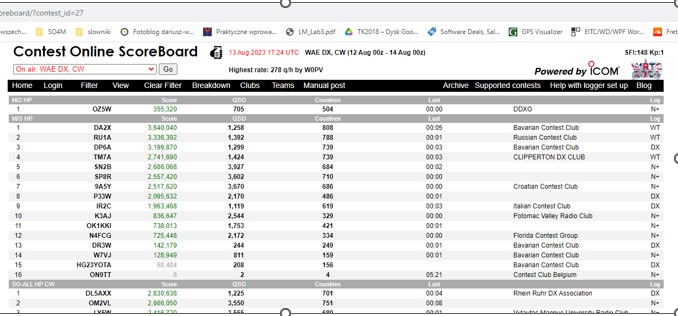
The page refreshes automatically. After logging in to the website, you can filter the data (e.g. select only one category). You can’t see the results of all participants here, but only those who decided to connect to one of the websites. It is not important which website we connect to, because the websites exchange data with each other.
At the SO4M station, we always use Score Reporting. We have an additional computer (it does not have to be connected directly to the log) on which we monitor the selected website. This is usually done by an operator who is not sitting at the radio at the time. We watch carefully who got closer to us, who overtook us, etc. This motivates us to work harder or consider whether to change the band, etc. Moreover, after clicking on the result of the selected station, you can watch “Band Totals” (if the station provides such information), which provides excellent material for comparisons with your own log.
The last thing related to the log (maybe only indirectly) is the use of the Reverse Beacon Network RBN during CW contests. At SO4M, we closely follow RBN at certain stages of the contest. We observe the strength of our signal and compare ourselves with the competition. This sometimes makes you think about rotating the antenna or changing the band. Of course, you should look at the RBN readings taking into account the location of the compared stations, propagation, work strategy in the contest, etc.
After contest
- Contest Analyzers (SH5, Qscope.or
- Competitio logs
- 3830
- K0RC – MS Excel (unfortunately no longer available and not developed)
- UBN Reports (Unique/Busted/Not-In-Log)
There is an intense discussion about the result achieved among the SO4M station operators for a week or two weeks after the competition.
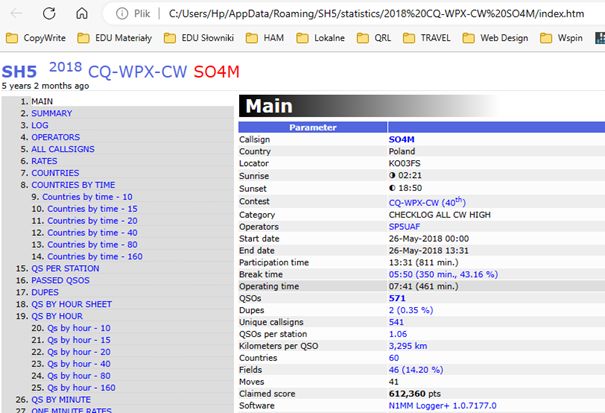
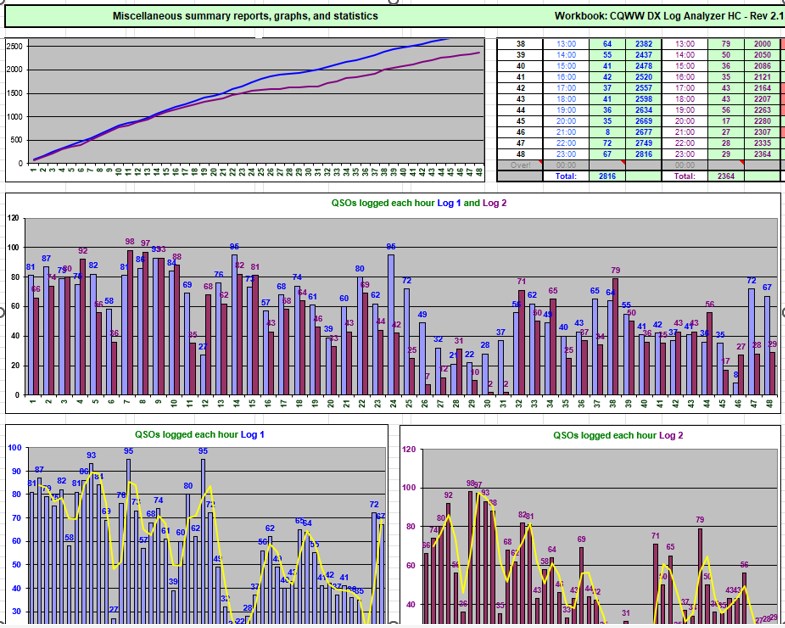
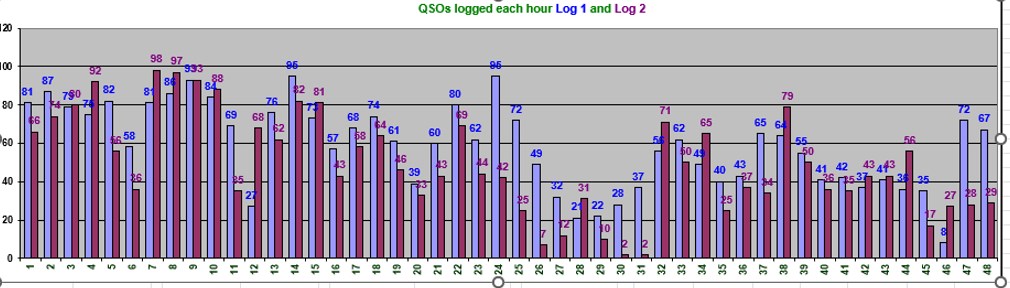
The first thing we do is import the log into SH5. This is a program written by UA4WLI, intended for analyzing the content of the contest log. The program imports the indicated log and creates several dozen reports, allowing you to verify the quality of the log and verify various quantitative and statistical data, e.g. :
- Number of connections with individual countriei
- Number of connections with individual continents
- Number of connections with individual zones
- Number of connections per hour
- Number of connections per minute
- Best tempos (rate)
- Potentially incorrect calls
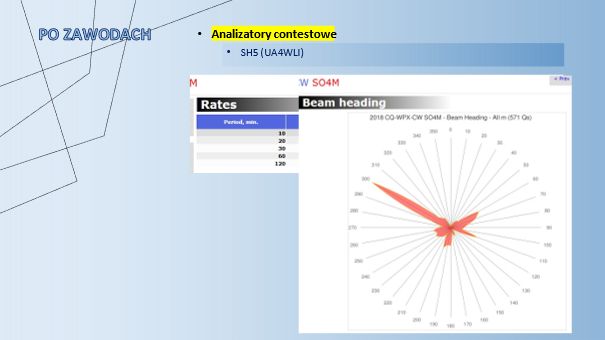
- Beam headings
- Number of connections of individual operators (for Multi-Op logs)
- E.t.c.
Data is presented in tabular form or, if possible, in the form of charts. The program is very fast and convenient to use. The reports are generated in web page format (HTML) and can be viewed using your favorite web browser.
The SH5 program is commercial. You must purchase a license – the purchase is one-time, forever. At the moment, due to the situation in Russia, the author has suspended the sale of the SH5 program.
Tools available on Qscope.org have similar tasks and options as the SH5 program. The website is completely free, although voluntary support for maintaining the website and developing the website is welcome. After registering on the website, the user can import their logs and create various summaries and statistics.
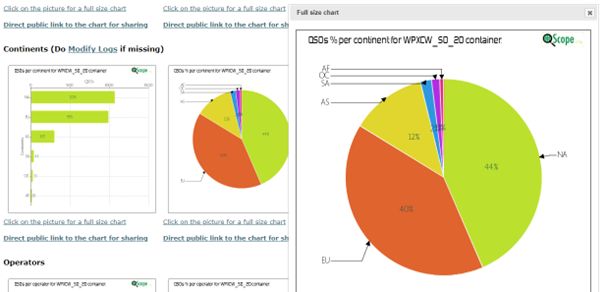
It is difficult to discuss SH5 or Qscope.org in detail here – you should just try it and start analyzing the rankings offered by the mentioned software.
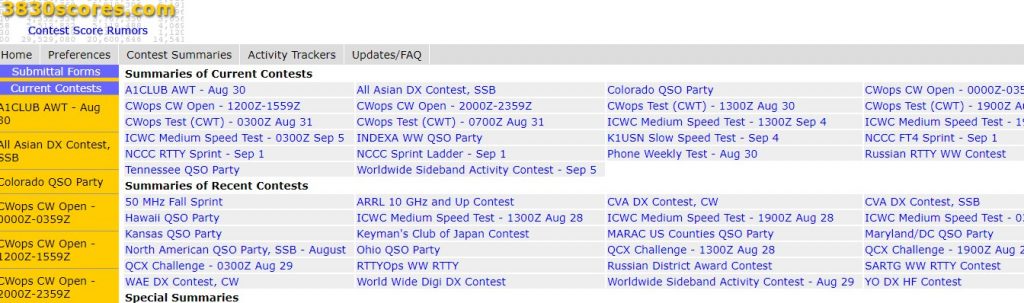
Another place that we verify several times a day for about a week after the competition is 3830scores.com. Every competition enthusiast knows this place perfectly. Many stations, after completing their work in the competition, send a summary containing the final result to this website. This is done not only by the world’s top contestants, but also by many “small” stations that simply want to share their results. At the SO4M station, we also send our results to the 3830 service. Thanks to such activities, even before the results are announced, results can be compared based on the reported results. After the organizer verifies the logs and announces the final results, this initial order often changes.
Sharing your achievements both during and immediately after the contest is a very good practice, proving the openness of the contest environment. The results published on 3830 are often supplemented with commentary (sometimes extensive) about the course of the contest, the station, etc. It is worth following, reading and drawing conclusions.
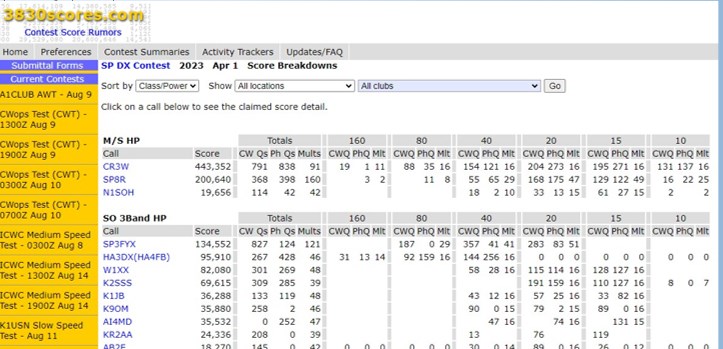
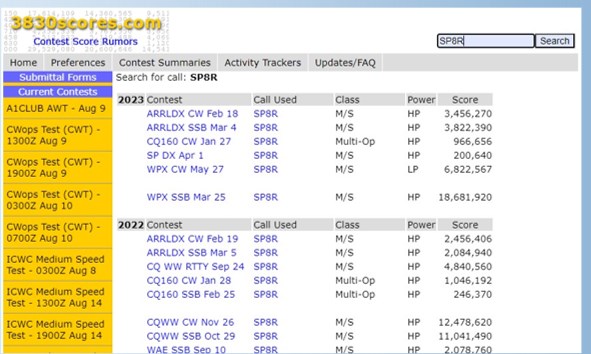
The images below show some of the 3830scores.com screens. As you can see, you can search this website by: individual competitions as well as search for the station callsign to check the reported results.
Overview of the results of selected contest:
Search by station callsign:
A few years ago, specially prepared MS Excel sheets for analyzing contest logs were available on the Internet. The author of these sheets, Robert Chudek K0RC, put a lot of work into their preparation and development. Unfortunately, these tools have not been developed for many years and are difficult to find. Generally speaking, the MS Excel spreadsheet designed by K0RC allows you to import two logs and compare these logs: in a table and on the example of charts. Some of these comparisons can be seen in the images below:
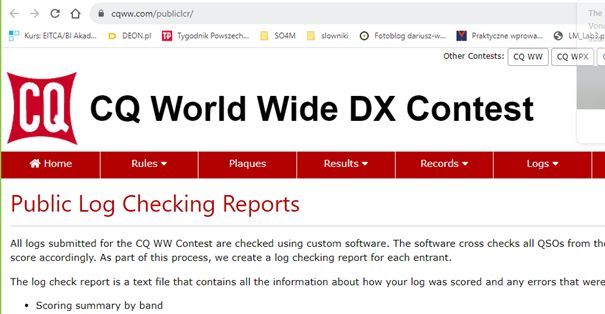
The last thing to mention when talking about the use of logs is UBN (Unique / Busted / Not-in-Log) reports. Not every contest organizer provides this type of data, but in many cases they are available to participants (e.g. CQ WW, CQ WPX or SP DX Contest). In the case of CQ WW or WPX, all contest participants receive password-protected access to their UBNs, and the UBN reports of the leading stations are available to everyone. For other professions, UBN reports are available to everyone, without any restrictions.
The UBN report is a very valuable source of knowledge if we understand the information it contains. K8ND has written a fairly comprehensive guide on UBN reporting in CQ WW competitions. It is worth reading this material:
http://www.k8nd.com/Radio/Planning/CQWW%20CW/Guide%20to%20CQWW%20DX-Contest%20UBN%20and%20NIL%20Reports.htm.
On the CQ WW competition website, UBN reports of the leading stations in particular categories are available (for everyone).
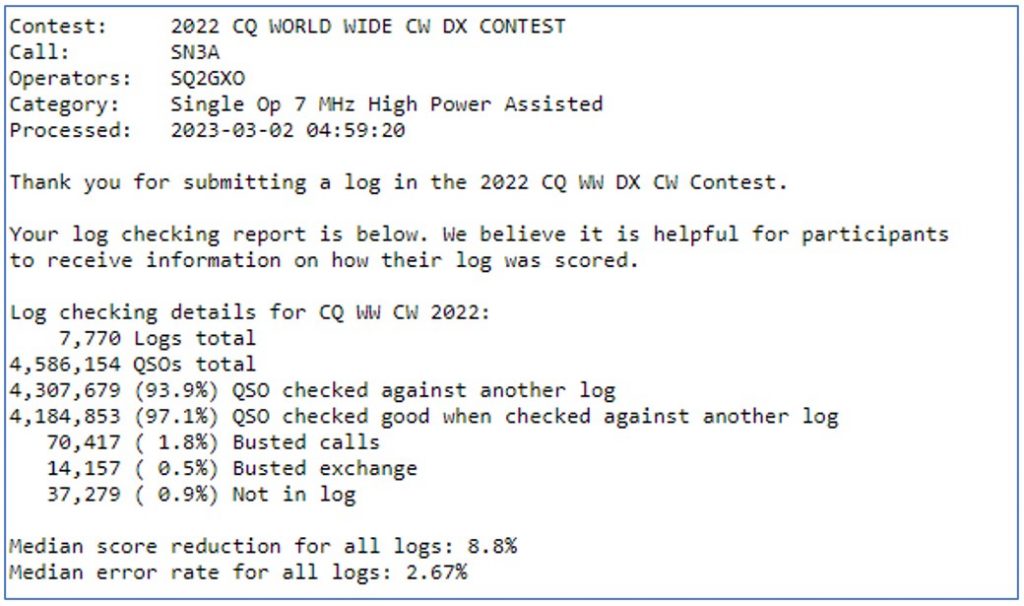
Let’s look at some fragments of the UBN report using the example of the SN3A station log for CQ WW DX CW from 2022. The station operator was Marek SQ2GXO. It was a single-band start, in the 40-meter band, High Power Assisted.
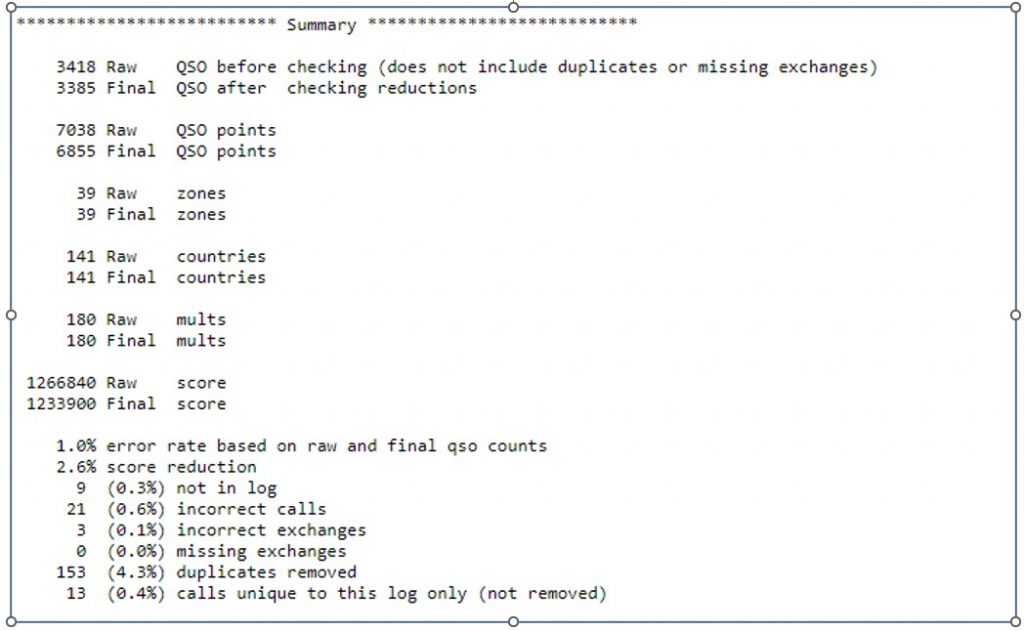
The first part of UBN is a general summary of the contest. Contains, among others: information on the number of logs received, the number of communications carried out by participants and the results of verification of all logs.
The next part of the UBN report is a summary of a specific log, in this case the SN3A log: here, among others, the number of QSOs and multiplier reported, the number of QSOs and multiplier passed (after log verification) and the final result (reported and after verification). Information about how many points were lost as a percentage is also provided here.
The next parts of the log contain detailed information about the contacts that showed errors during verification.
- Not In Log section is a list of those contacts that were included in the SN3A log, but were not found in the correspondents’ logs (the correspondents sent the logs).
- Incorrect Call section contains a list of calls where the verification algorithm showed that the operator of the SN3A station incorrectly received the correspondent’s call.
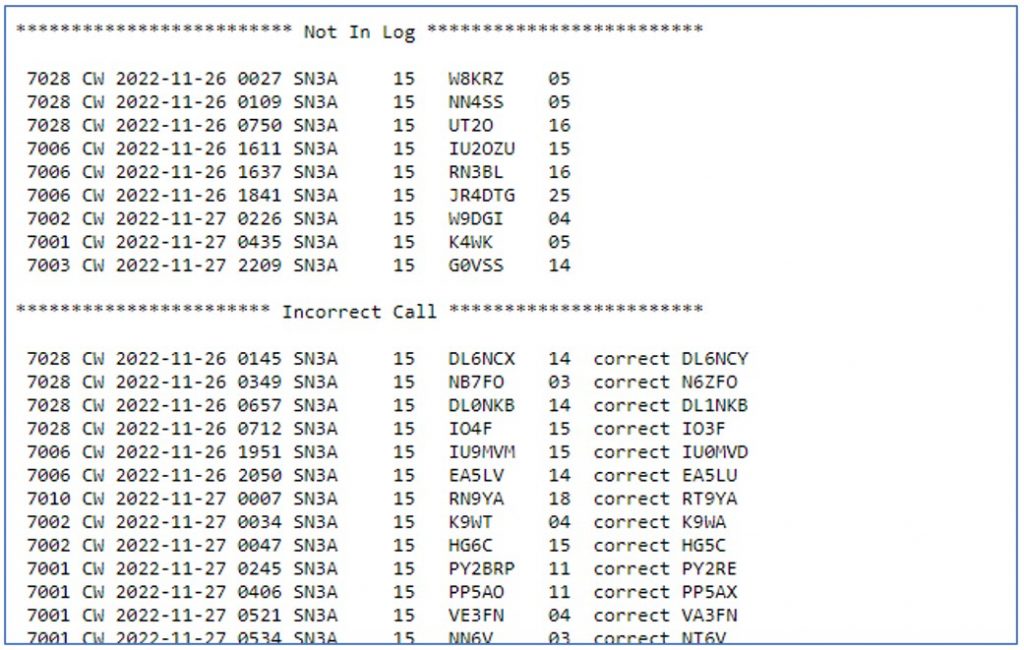
Penalty points are deducted for Not In Log errors and Incorrect Call errors. For each error from this group, points are deducted, which are twice the value of points for incorrect QSOs.
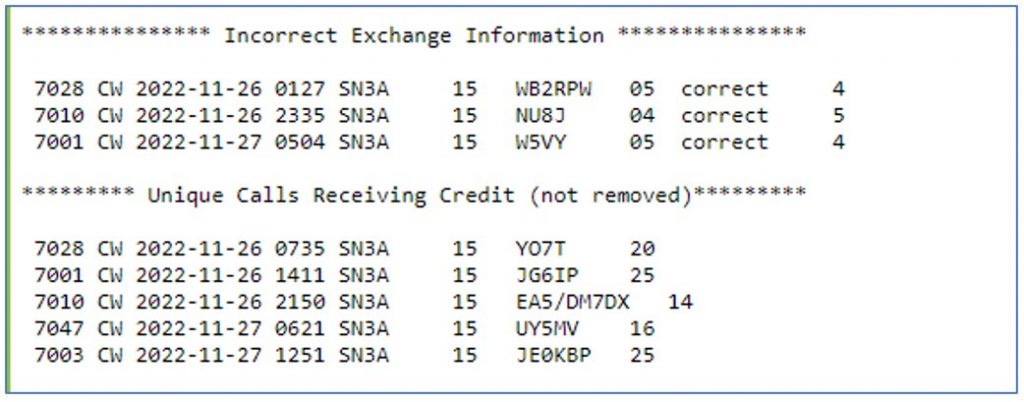
The next section of the UBN report is the Incorrect Exchange Information section. Here is a list of errors regarding errors in the received report. For these types of errors, you lose points for that contact, but no additional penalty points.
And finally the Unique Calls section. These are the so-called Unique calls. The owners of these calls did not send logs, but there are no grounds to remove these calls from the log. These types of contacts are included, but are additionally listed in the UBN report for information purposes.
The UBN report may contain other types of errors. We refer you to the K8ND guide.
By the way, the SN3A log used to describe UBN is an example of an excellent operator level. Over 3,400 reported contacts in the 40-meter band – a difficult band to work with. Of these, 3,385 contacts were completed. The loss of points is 2.6% compared to the reported result. Well below the all-log average of 8.8%.
If you have a UBN and your own copy of the log and use e.g. MS Excel, you can easily create a summary showing, for example, the number of errors made by each operator (in the case of the log from the Multi OP station and assuming that we checked the operator’s calls change during logging). Such information can be very valuable for everyone – in the SO4M group, for example, we have come to the conclusion that it is worth regularly practicing the reception of signs in the Morse Runner program between contests. We even have our own local competition – all to improve our skills and be better prepared for the contest.
Finally, it can be added that virtually all the activities and analyzes we perform after the contest are repeated before the next edition of the contest. After the contest, analyzes are performed immediately, we often remember individual contacts and are able to recall some facts. However, before the next edition of the competition, the same analyzes have a nearly one-year perspective, they are performed calmly and with a focus on specific tasks that need to be completed before the start.
The ways of using the contest log listed and described in this article probably do not exhaust all the ideas and possibilities, but they certainly describe methods commonly used by many operators. Each participant has a cotest log, so why not use all the information that results from analyzing the log. I usually compete with members of the SO4M team in Multi-OP categories. However, sometimes I also work in contest from my own station, where I only have a vertical HF9V and a G5RV antenna at my disposal. Working from my own station, I have no chance for top places, but I compare myself with those who overtook me, check my log, analyze the mistakes made, draw conclusions – all in order to be a better version of myself during the next competition. After all, that’s what every competition is about.
Tom SP5UAF
Leave a Comment