
The 2.4 GHz 20W power amplifier from the Bulgarian company SG-Lab is widely used among the OMs (including QO-100 sattelite fans) [1]. In addition to the attractive price, this is also due to the excellent workmanship and delivery in the milled aluminum housing. The PA contains three internal directional couplers for measuring input, output and reflected power.
The PA monitor presented here can also be used for other PAs if modified accordingly and offers the following functions:
– Measurement and display of the powers DRV, FWD and REF
– Calculation and display of the standing wave ratio SWR
– Display of the operating voltage
– Measurement and display of the PA temperature
– Switching function for fans when the temperature is exceeded

The calibration curve (red) of the directional coupler DRV is shown in Fig.2, the FWD curve in Fig.3. The measuring points were kindly given to me by SG-Lab.com and represent the average of many copies. Since the REF coupler is constructed identically and is positioned symmetrically to the FWD coupler, it may have the same characteristic. In general, however, it should be noted that a high reflected power REF (SWR) can kill the transistor output stage. The fault tolerance should be ± 7% based on the voltage values. Due to the steepness of the characteristic curve, the error in relation to power is correspondingly larger (green area). A value of 22 dB – 25 dB was mentioned as the selectivity of the coupler.
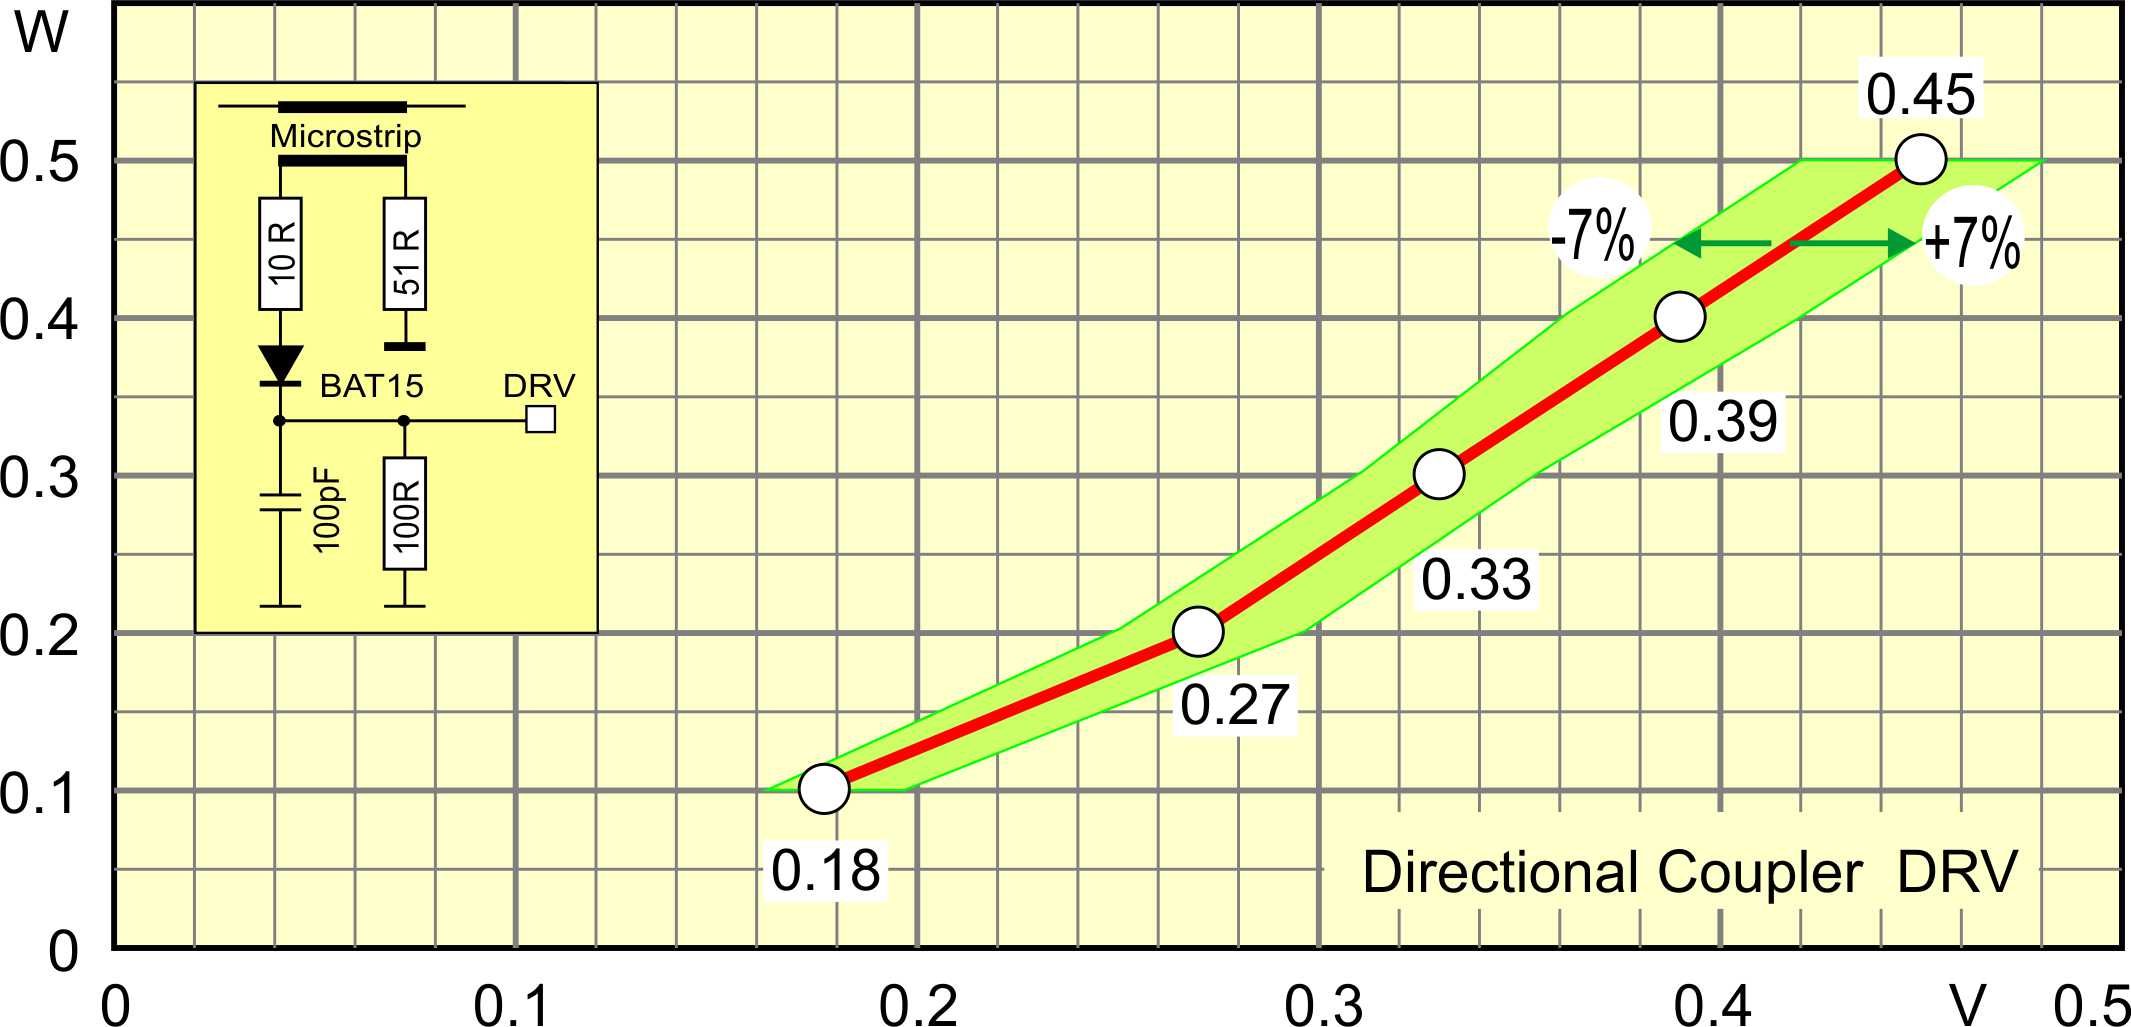
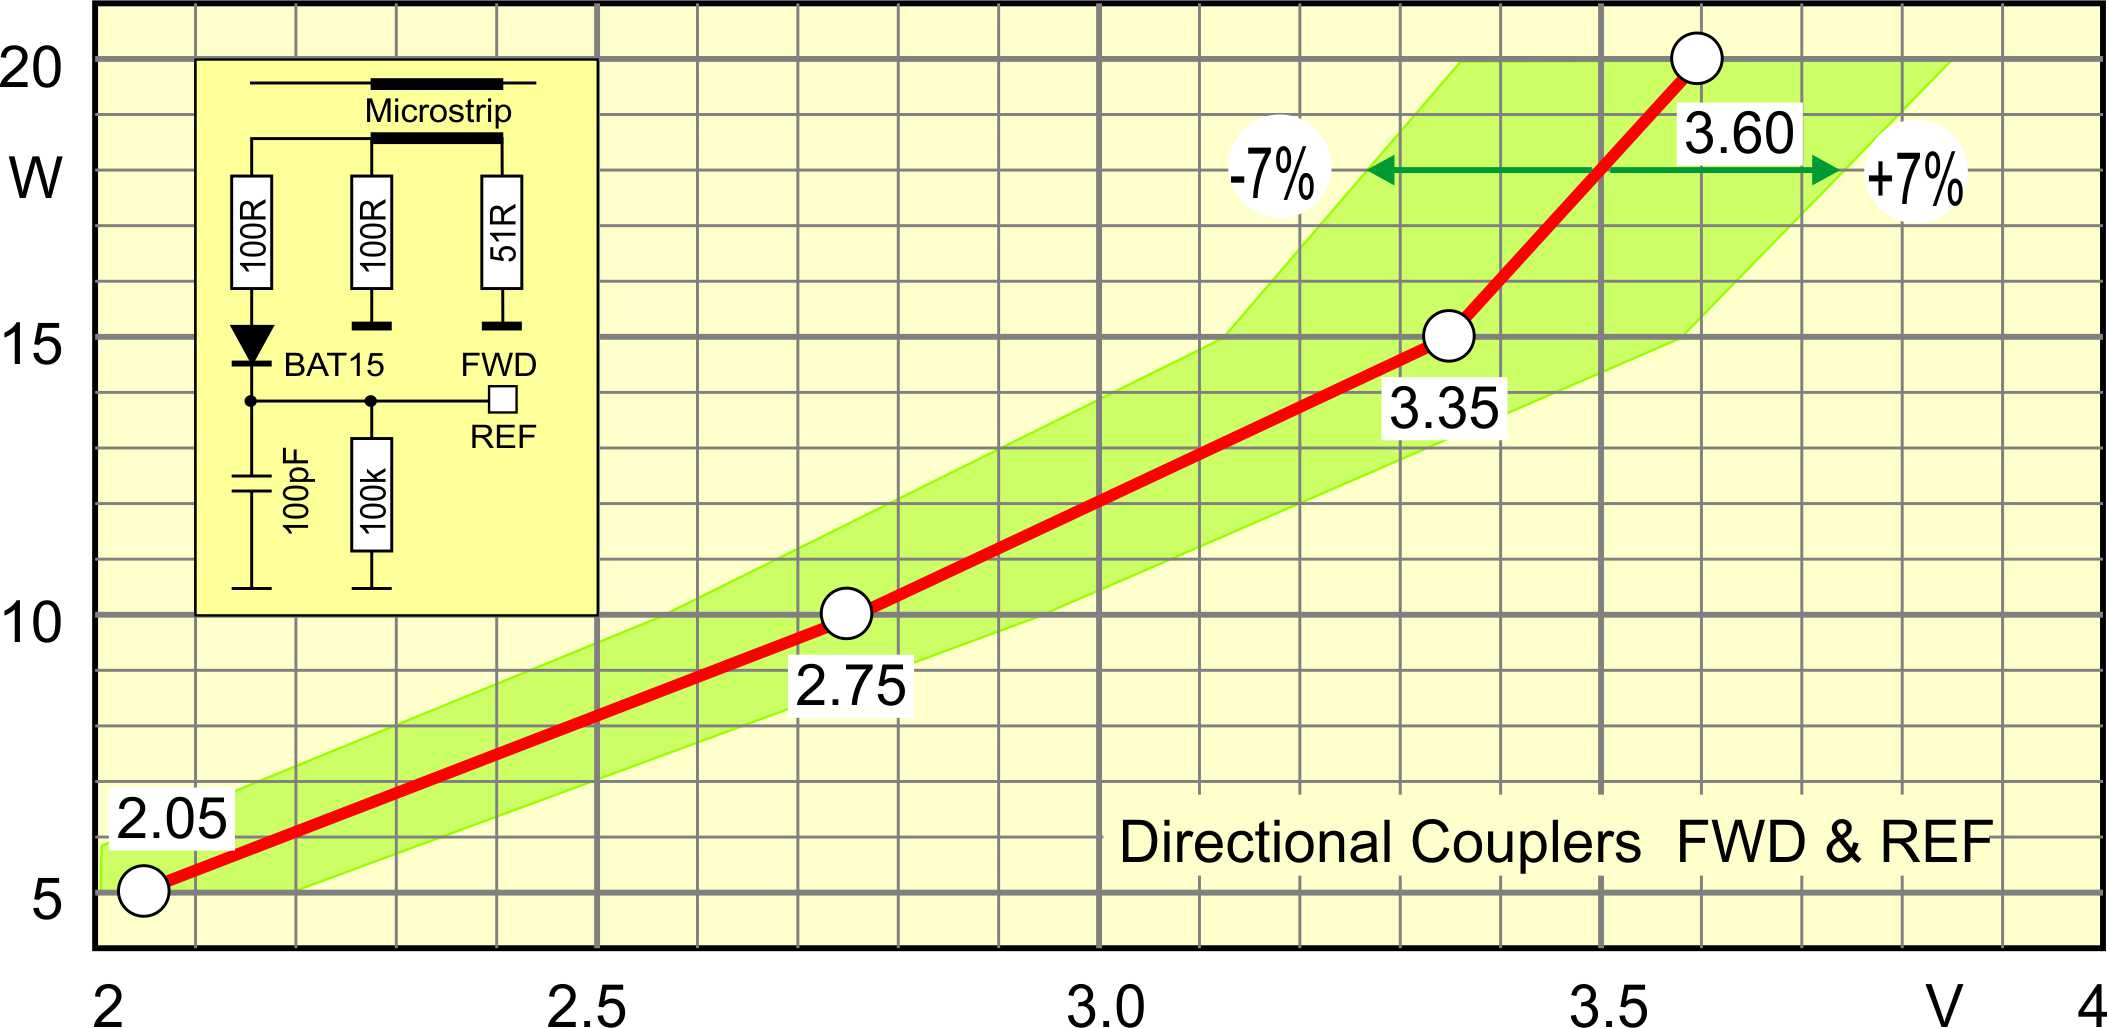
For digital signal processing, the calibration curves must be in a mathematical form. The curves were approximated with a 2nd degree polygon function in the form:
y = a + b * x + c * x * x
The coefficients were determined using an online polynomial regression calculator [2]. The number of measuring points and the desired degree of the polynomial are entered here first. The voltage values are written in the x column and the associated power values in the y column. A degree level higher than 2 is not advisable since the temperature of the coupler diodes also affects the characteristic curves. The temperature influence can be reduced by good cooling of the PA.
The coefficients for the characteristic DRV, FWD and REF were determined this way. The probability that the directional coupler curves of your own PA correspond exactly to the average values of SG-Lab is low. It is better to determine this yourself if you have correspondingly precise measuring devices available (more info in the Documentation ). A friendly OM from the club will be happy to help out.
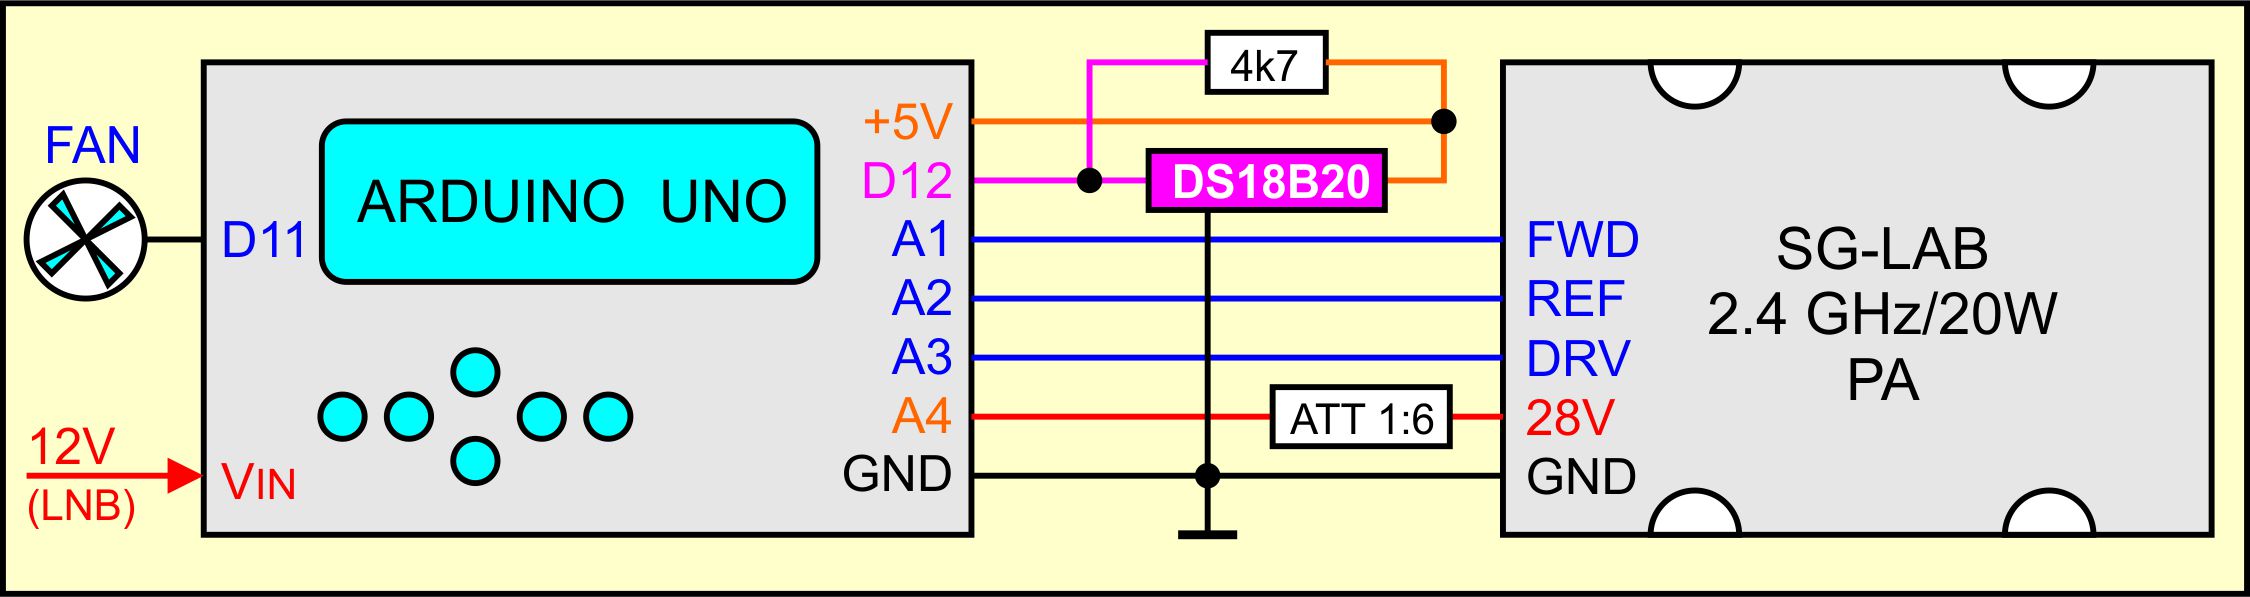
The measurements, data processing and display of the PA monitor is carried out by an Arduino Uno with an attached LCD keypad display. Fig.4 shows the wiring to the PA and the Dallas DS18B20 temperature sensor.
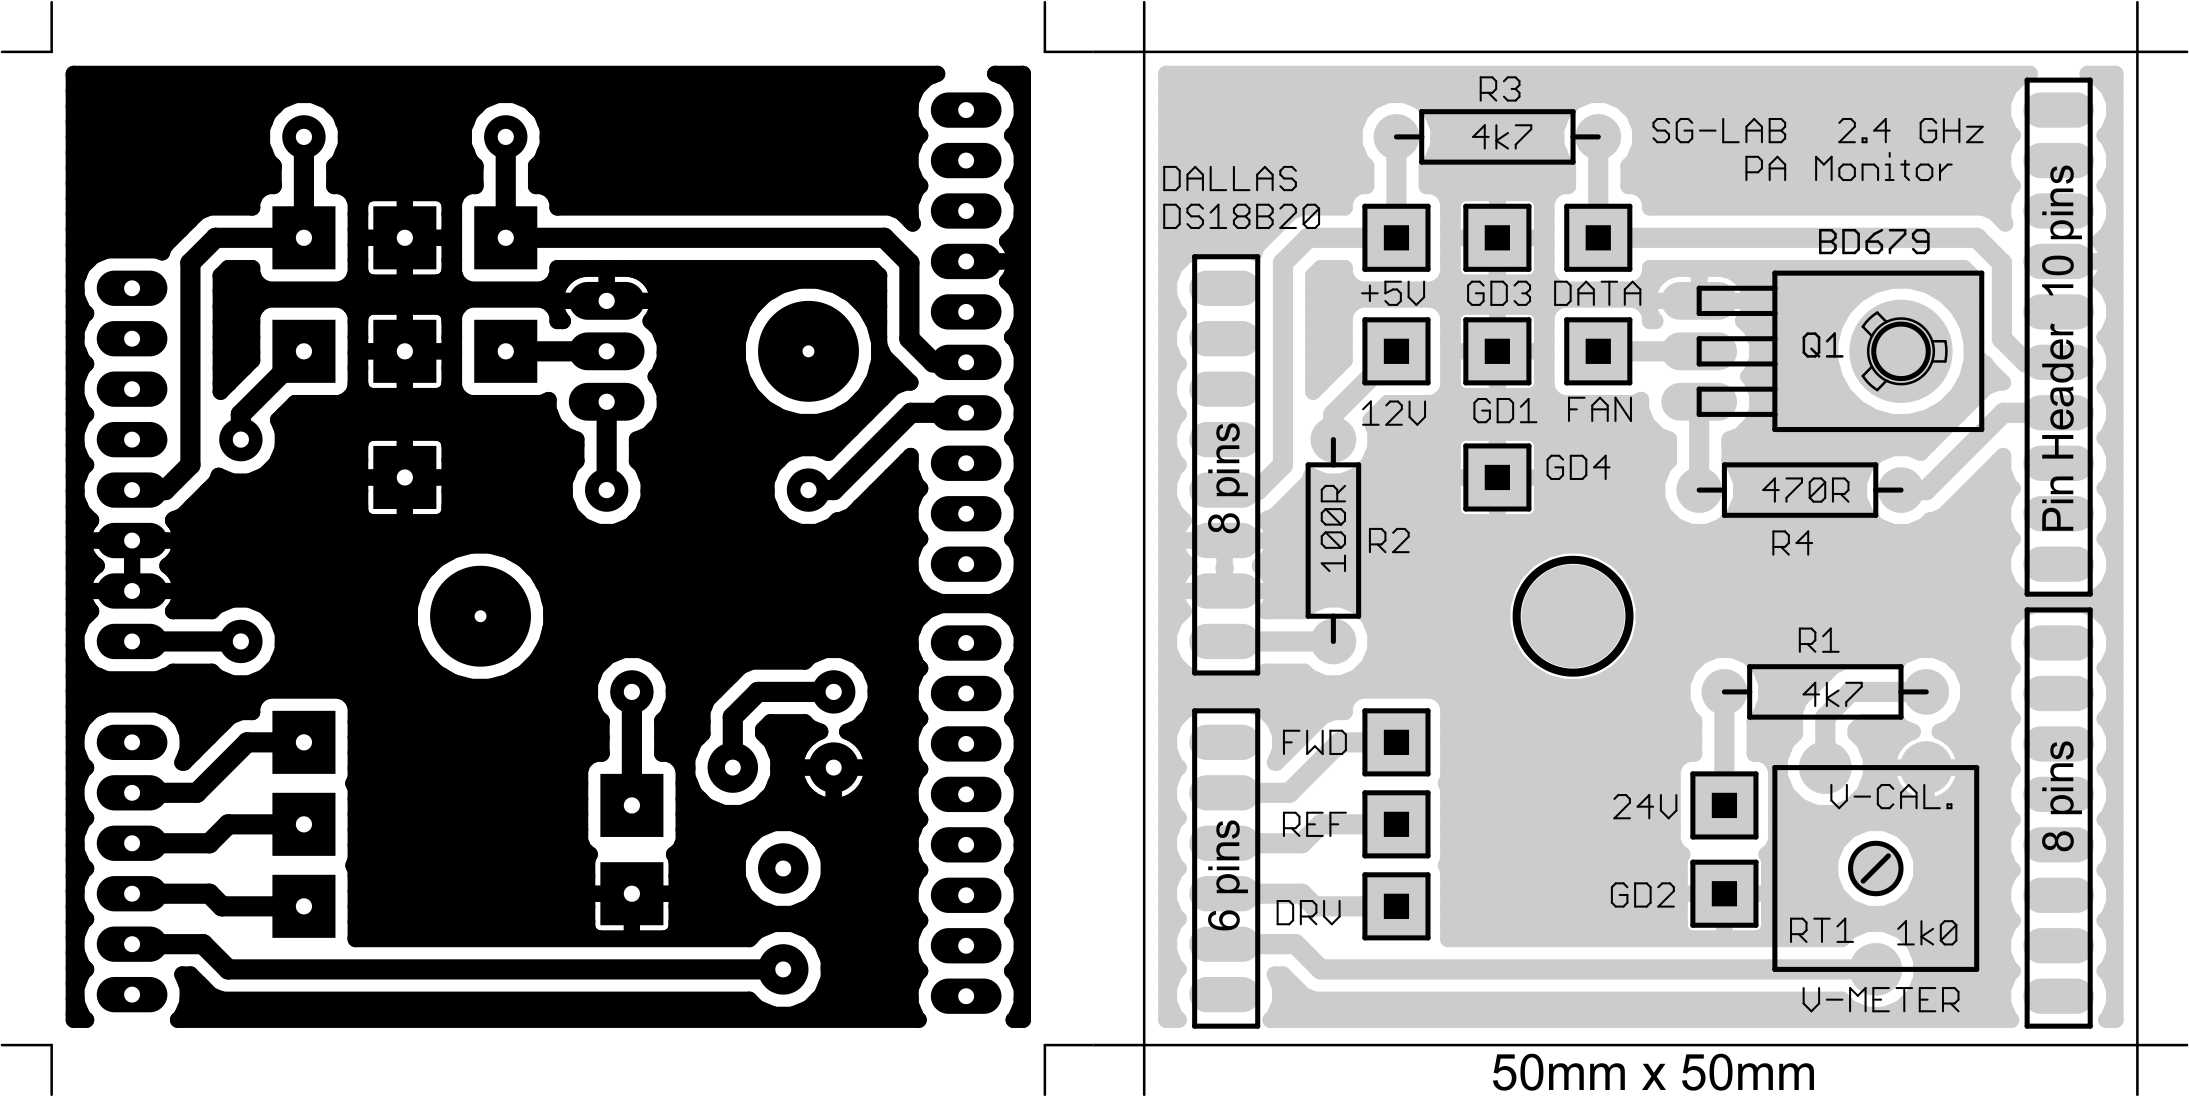
The circuit (Fig.5) can be built on a grid board with conventional wiring. The use of a “bottom shield” is more elegant. It is a circuit board which is equipped with 4 pin headers. This is plugged from below onto the inner pad row of the Arduino Uno soldered to socket strips (Fig.6).
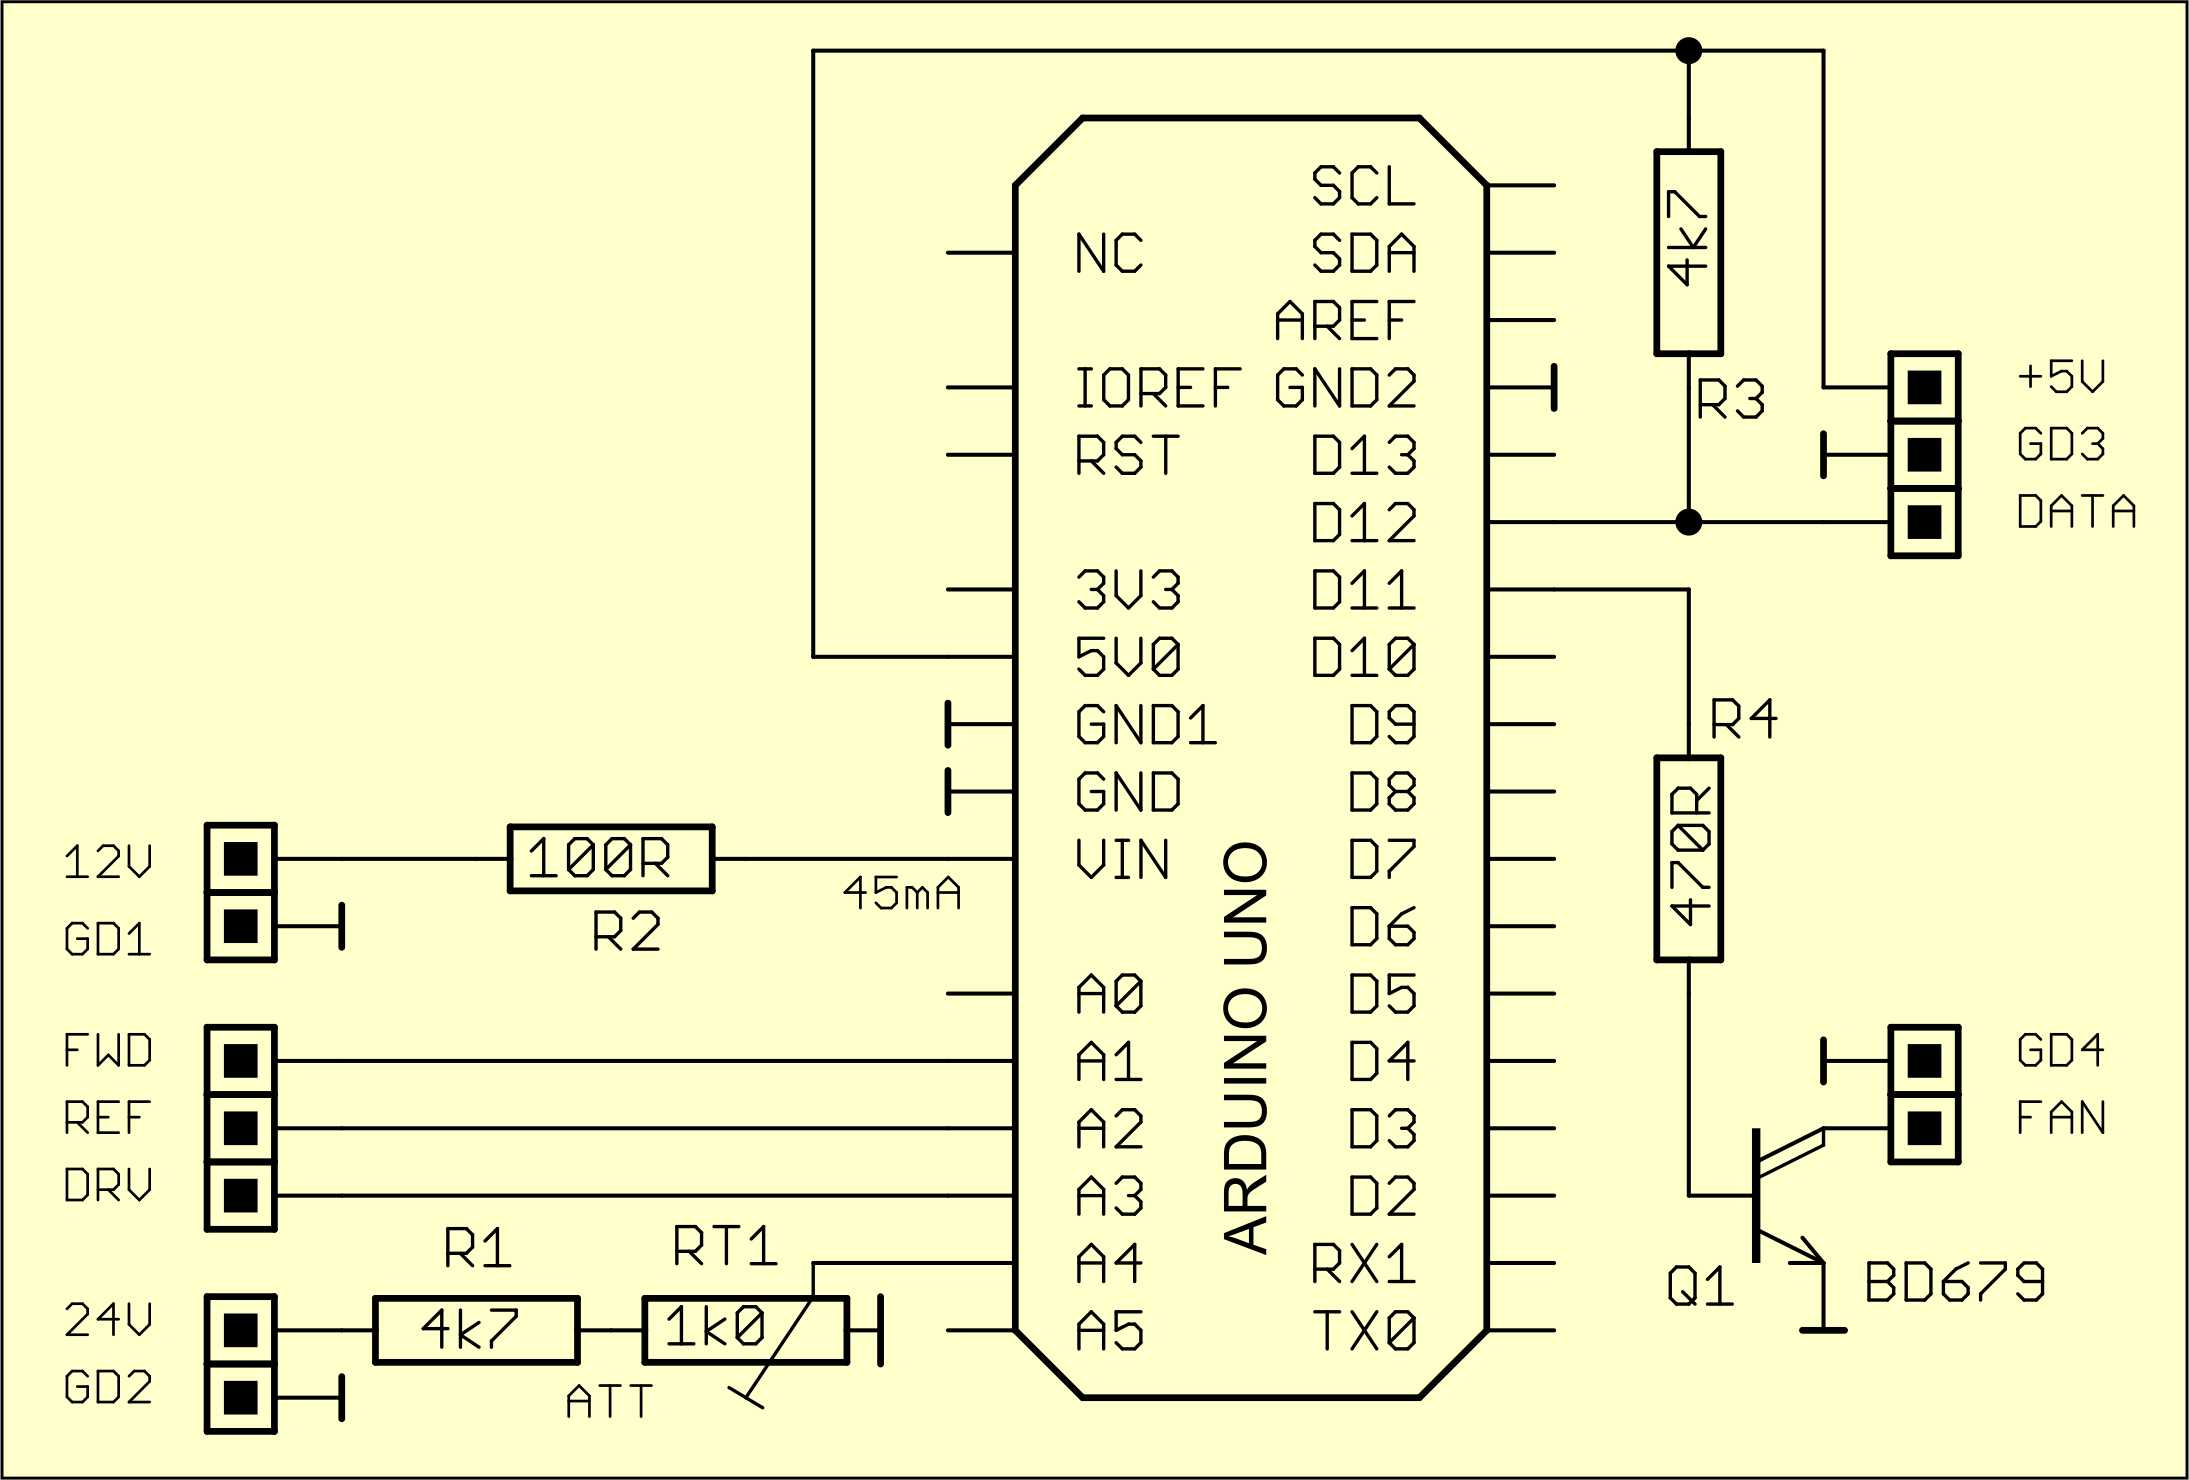
.
If the PA monitor is to be installed in a housing or in a front panel, it is advisable to replace the SELECT button on the display with a type with a long pen [3] and to solder the contrast potentiometer out and place it at the bottom (Fig.7).

In the Documentation zip file you will find an alternative version with the Arduino Nano which implements a smaller structure.
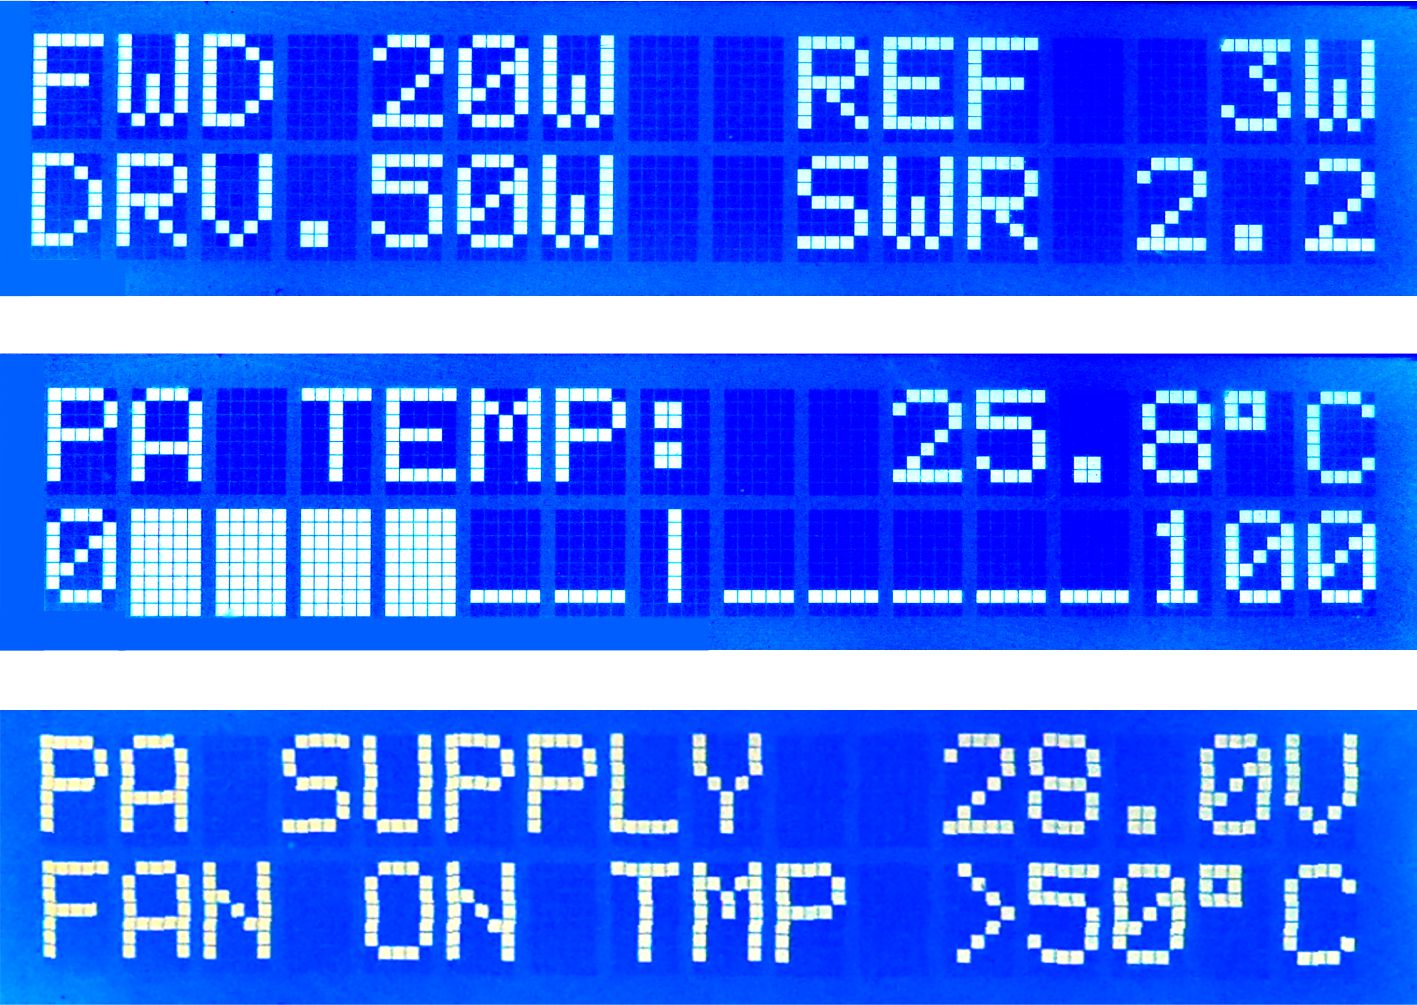
The Arduino PA monitor program consists of three menu items which can be selected sequentially by pressing and holding the SELECT button (approx. 1s) (Fig.7).
Menu 1:
If the measured values of the FWD or REF couplers are below the minimum values of the calibration curves defined in the sketch, this is shown on the display. In this case, the SWR cannot be determined. The PA temperature is then displayed instead of the SWR.
Menu 2:
Temperature display with decimal point and representation in the bar graph
Menu 3:
Display of the operating voltage of the PA and the switch-on temperature of a fan. If the fan is active, “ON” or the degree symbol ° flashes.
In the sketch (look in the Documentation zip file) the calibration values of the curves are identified by an asterisk box (******). These should be replaced by self-determined coefficients. The temperature from which a fan is activated must also be entered here. All information for the replica can be downloaded from the hf5l.pl server [4].
Appendix
[1] http://www.sg-lab.com/amateur.html; email: info@sg-lab.com
[2] Free Polynomial Regression calculator; http://www.xuru.org/rt/PR.asp#CopyPaste
[3] Search on ebay: Momentary Tactile Push Button Switch 6*6*(4.3-15mm) Mini Micro Small PCB Mounted
[4] https://hf5l.pl/en/pdfs-2/
by Reinhardt Weber, DC5ZM
email: weber.r1@t-online.de
Number of Comments: 1
Hello OM’s
i build that PA Monitor, Thx DC5ZM for that project. During testing i blew the diodes of the FWD and REF output of my AG-Labs PA. Like due wrong settings, or during MCU initialization, the Arduino board can set both ports to outputs. They can deliver 5V/30mA , probably this voltage is enough to damage both diodes.
Feedback from SG-Lab: The best solution is to add 1-2kohm resistors in series on these lines. As the measurement input has very high impedance, >1Mohm, both resistors cannot affect the measurement. But with 1kohm resistor the current will be limited to about 2-4mA and diode will survive.
73, Martin OE9SAU